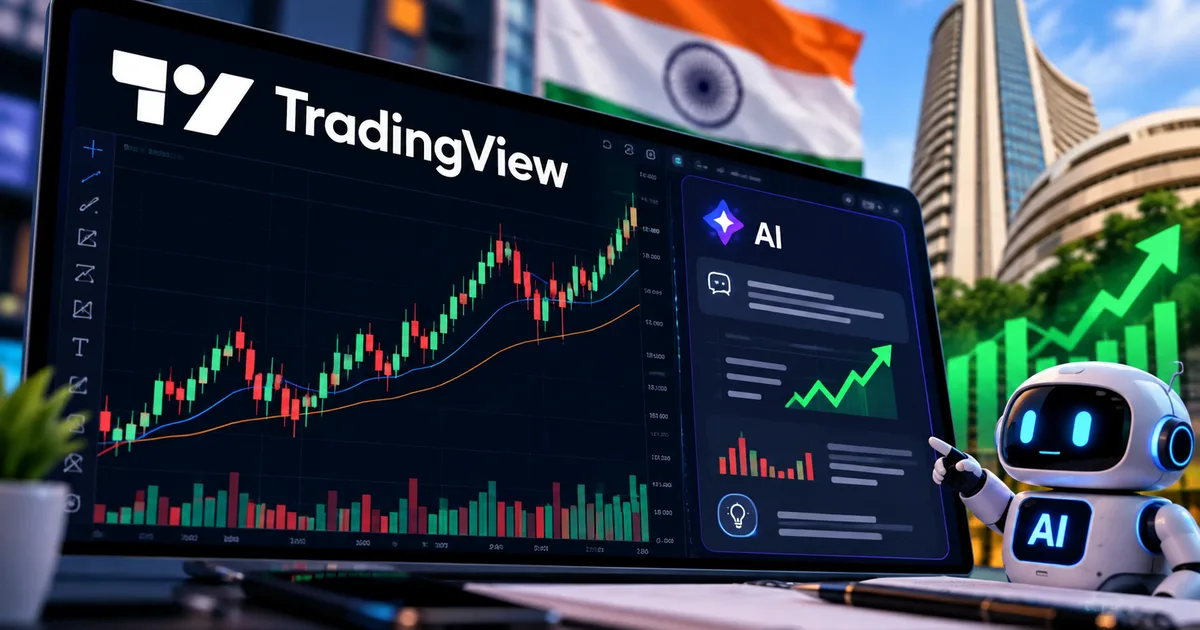
If you spend any time looking at stock charts, you know the grind. You flip through dozens of Nifty 50 components, trying to spot a decent setup before the market opens. The new TradingView AI integration 2026 is supposed to fix this. They just pushed their AI Chart Copilot into public beta, and honestly, it changes things for retail traders in India.
I tried it out this morning on some banking stocks. Usually, I spend an hour drawing trendlines. The AI did all that heavy lifting in three minutes. It's a massive shift.
But let's be realistic here. It isn't going to predict the future. It won't magically make you a profitable trader if your risk management is terrible. What it does is save you a ton of time. You get to actually think about your strategy instead of just connecting dots on a screen.
What exactly is the new AI copilot?
Basically, TradingView slapped a smart assistant right onto your charting screen. Instead of clicking through menus to apply a moving average, you just type what you want in plain English. Or Hindi, if you're using an external translator. Native support is still English-first (which makes sense, actually).
You can type something like "show me major support levels on Reliance" and it just draws them. It's that simple. The system understands the active ticker. It knows the timeframe you're currently viewing.
The really interesting part is the backend tech. They finally added support for the Model Context Protocol. If you keep up with Latest Tech News, you know this lets external AI agents securely connect to apps. You can hook up advanced models to read your live charts. I think it's a huge step up from last year's tools.
I dug through the recent updates. They're running this on some serious hardware. There are reports of a 7 billion dollar Oracle AI chip lease driving these new features. That tells you they're throwing serious money at making this fast for millions of users.
How this changes the Indian stock market experience
Trading in India is incredibly fast right now. With the new SEBI ASBA-UPI Mandate for Secondary Market Trading: 2026 Guide for Indian Investors rolling out, regulations are tightening up. But execution is wild.
We're seeing global AI stocks slide a bit right now based on recent market warnings. People are worried about a slowdown in tech spending. But the AI tools are just getting better. Look at Indian IT stocks. Netweb Tech and E2E Networks took a hit recently over AI fears. They fell up to 7 percent. Yet consumer products like this charting assistant are finally useful and hitting the mainstream.
Thing is, regular traders in Mumbai or Delhi have day jobs. You can't just sit in front of a screen from 9:15 AM to 3:30 PM. You have to analyze the market quickly after hours.
- The AI can scan your entire watchlist in seconds and flag setups based on your exact criteria.
- It highlights unusual volume spikes that you might miss while looking at price action alone.
- It explains complex technical indicators in simple terms, which is great for beginners trying to learn.
- It can summarize recent news events that might affect the stock you are currently viewing.
I find the explanation feature incredibly helpful. Sometimes you throw an Ichimoku Cloud on a chart and immediately regret it. It just looks like a mess. But now you can ask the AI what the indicator is signaling for Tata Motors right now. It gives you a straight answer without the jargon.
Step-by-step guide to setting it up
Getting started is straightforward. You don't need a special invite anymore. It's in public beta.
First, log into your TradingView account on your desktop browser. The mobile app features are a bit limited right now. So stick to a computer. Look for the new sparkle icon on the right side panel. That's your entry point to the copilot.
Click it to open the chat window. The interface looks exactly like ChatGPT. But this one knows what chart you have open. It's context-aware.
Here's what you should try first.
Open the chart for State Bank of India. Make sure it's the NSE chart. In the AI chat, type: "Identify any bullish candlestick patterns in the last month."
Watch it work. It scans the historical data and drops markers right onto the chart. It will highlight the exact days a hammer or engulfing pattern showed up. If you ask me, the visual feedback is fascinating.
Next, try asking it to combine indicators. "Tell me when the RSI was oversold while the price was at the 200-day moving average." Finding that manually takes ages. The AI just spots it instantly.
Are these smart charting tools worth it?
Look, TradingView pricing has always been a major pain point for Indian retail traders. Paying thousands of rupees a month hurts when your trading capital is small. Their pricing model is getting a bit restrictive lately. They're pushing free users toward paid plans (annoying, I know).
Lots of core features are locked behind higher tiers now. If you're comparing AI Tools & Software, you might wonder if you should jump ship. Platforms like altFINS and MEXC are launching big AI trading ecosystems too. They're fighting hard for market share right now.
Even MetaTrader 5 just added native AI agents in their latest beta. They did a massive overhaul of their broker tools. Competition is heating up fast.
But TradingView still has the best charts. That's a fact. The interface is really clean. And right now, during this public beta, you get to play with the AI features without a massive price hike. That might change soon. They'll probably put the advanced queries behind their highest paywall eventually. But today, in my opinion, it's highly valuable to test out.
"The integration of MCP means we are no longer locked into one company's ecosystem. We can bring the best models directly to our trading data, which levels the playing field for retail investors."
I'm not sure exactly why they haven't announced a timeline. I couldn't find a clear official answer on when they will exit beta and start charging extra for compute time. So just use it heavily while it's unrestricted.
The reality of relying on AI for trades
We really need to talk about the risks. The Indian stock market is highly emotional. It reacts to global news and local politics. An AI looking at a chart doesn't know the Finance Minister just announced a major policy change.
It only sees price and volume. That's it. It has no idea about the real-world context driving those numbers.
If you blindly take a trade just because the AI highlighted a strong buy setup, you'll lose money eventually. I've seen it misinterpret complex market structures multiple times. I'm not sure exactly how it processes gaps, but it sometimes draws support zones in sketchy places if a stock gapped down. That happens with corporate actions like a dividend payout or stock split.
You have to treat it like a fast, slightly naive research assistant. It fetches the data. It highlights the interesting parts. But you make the final call before risking your hard-earned rupees.
I suggest starting small. Run your normal analysis first. Write down your thesis. Then ask the AI to do the same. Compare the results. See what it caught that you missed. See where it completely failed. Over time, you'll learn exactly which text prompts yield the best results for your specific trading style.
This is a massive shift in retail trading. We went from manually drawing lines on graph paper decades ago to clicking on screens. Now we're just talking to the chart. It's genuinely impressive technology. Just keep your position sizes small while you figure out the quirks.